Hooking zabbix api into grafana.
Eventually, I’m going to setup influxdb and telegraf for everything to get more accurate (and faster reporting) but for right now, here’s a good way to get grafana setup with some graphs. That’s all we care about anyway.
Create your new VM or login to whatever will be hosting your grafana instance.
nano /etc/apt/sources.list and add this
deb https://packagecloud.io/grafana/stable/debian/ stretch main
Save & close. Next, add the key;
curl https://packagecloud.io/gpg.key | sudo apt-key add -
And install grafana sudo apt update && sudo apt install grafana
To get it to start at boot
sudo systemctl daemon-reload
sudo systemctl enable grafana-server.service
And to start, sudo systemctl start grafana-server
You can access it afterwards at http://whatever-ip:3000, works out of the box with reverse proxies too, super straightforward.
grafana-cli plugins install alexanderzobnin-zabbix-app and restart grafana afterwards service grafana-server restart
Login to grafana (admin/admin) and go to plugins, then Zabbix and select Enable.
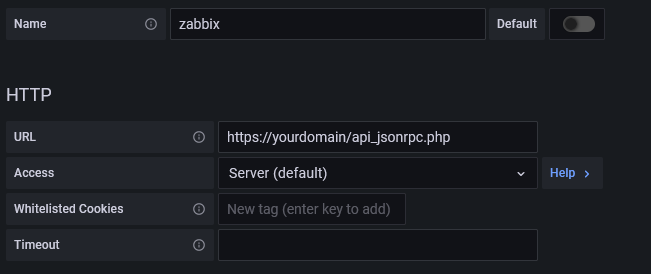
Next, we have to configure it to poll the zabbix api.

Up to date versions of zabbix have the API enabled for all users so it should work out of the box. Don’t forget to add /api_jsonrpc.php to your zabbix url.
You can stop here if you wish, but leave ‘trends’ and ‘direct-db connection’ disabled.
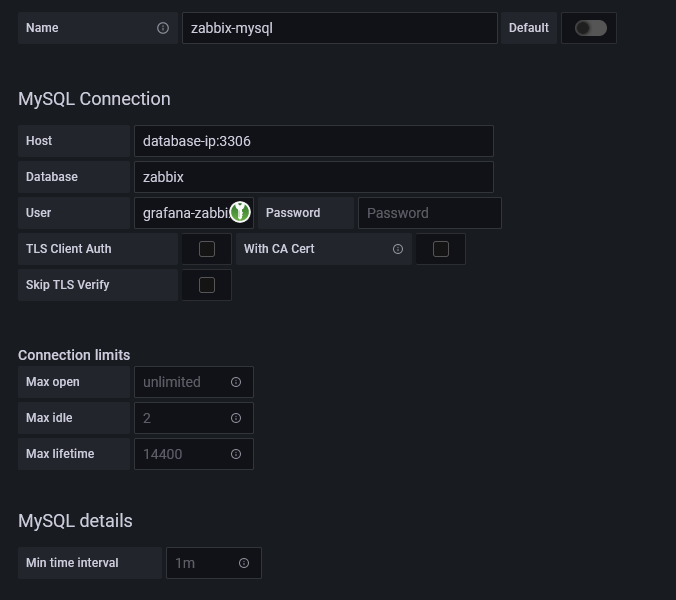
If you want to set these up you’ll need to add mysql as a remote data source. Luckily, that’s pretty painless too. Click on Settings, Data Sources, Add data source and select mysql.

Next you’ll need to login to your mysql server and create a new user and grant it access to the zabbix database;
mysql -u root -p
create user 'grafana-zabbix' identified by 'yourpassword';
grant select on zabbix.* to 'grafana-zabbix';
flush privileges;
exit;
Then hop back to the mysql data source page, hook it all up. Afterwards, you can go back into the zabbix plugin and enable ’trends’ and ‘direct db connection’ and you’re all set.

This plugin has several templates you can import to speed up the dashboard-building part, I’d suggest importing them to get a grip on what you want, then take it from there.